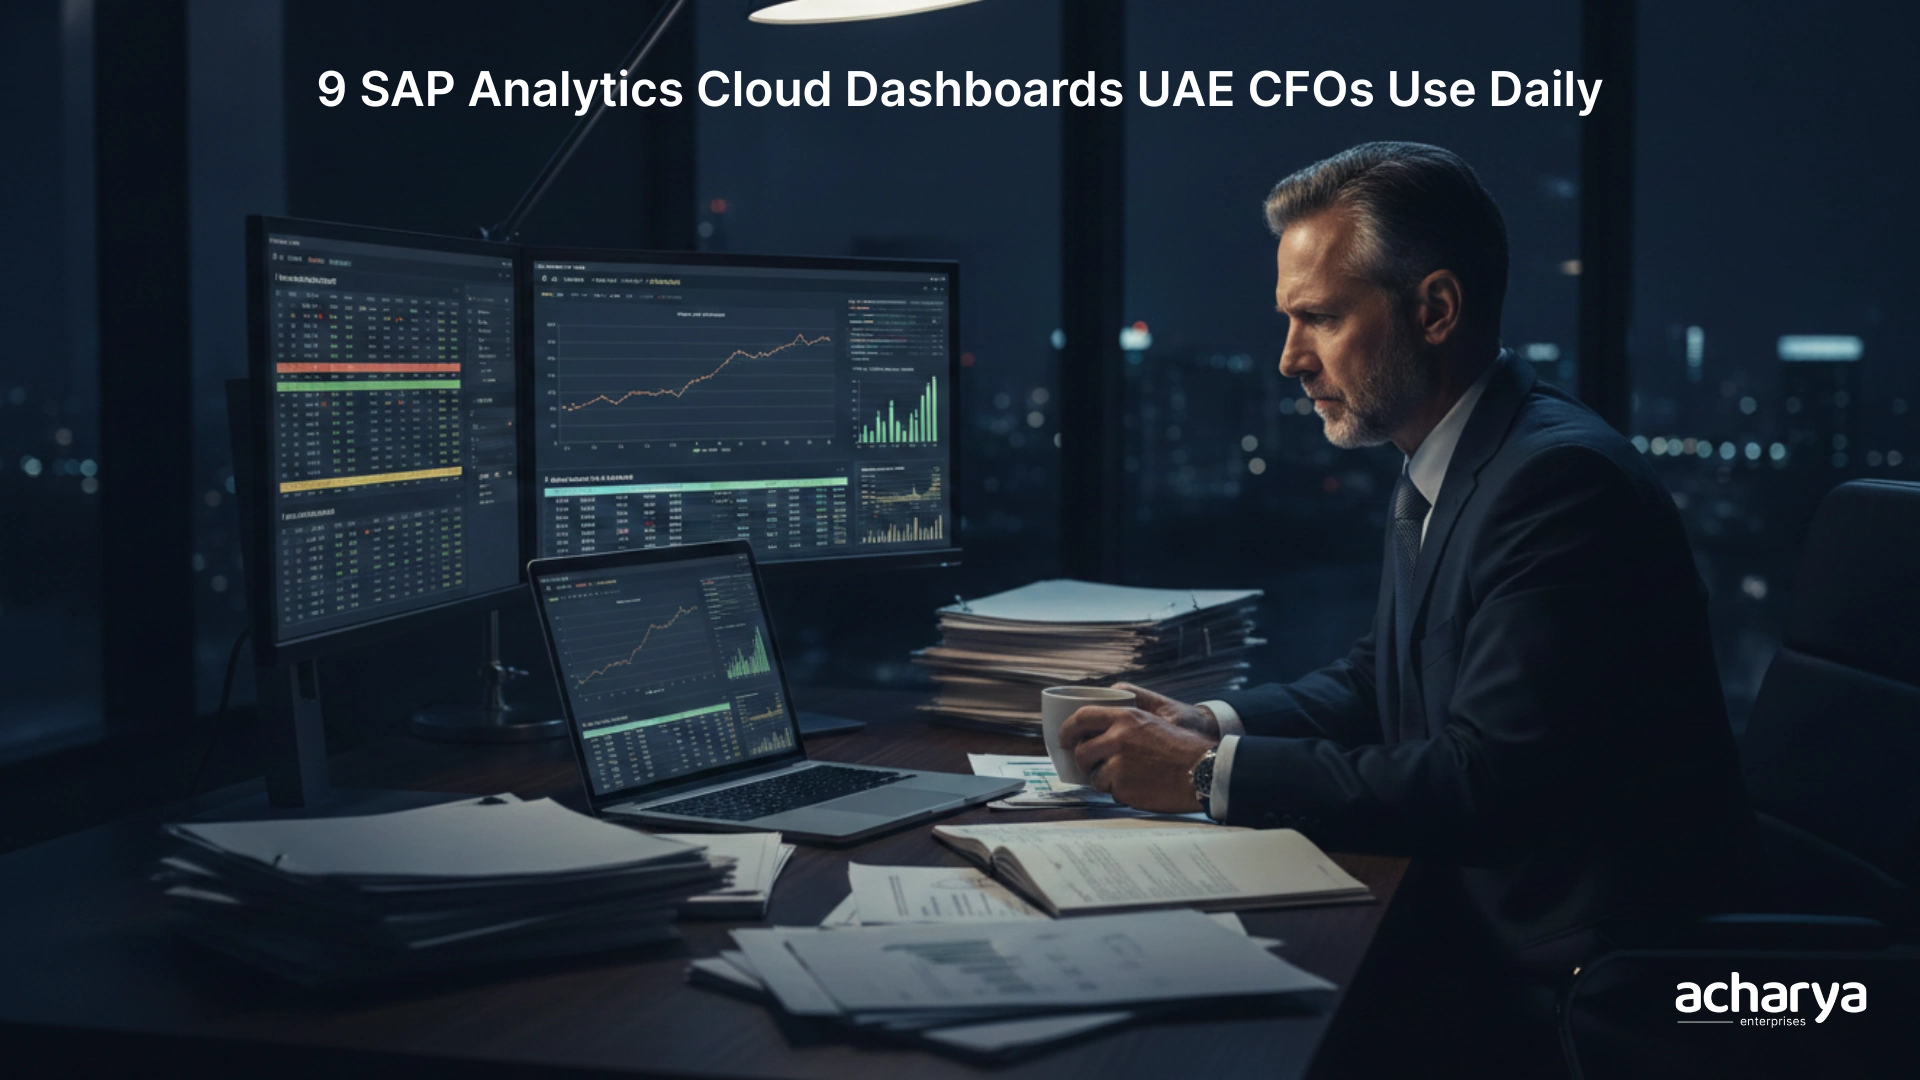
9 SAP Analytics Cloud Dashboards UAE CFOs Use Daily
SAP Analytics Cloud dashboards UAE CFOs depend on have become central to daily decision making. Finance leaders no longer wait for month end reports. They use real time dashboards to track performance, risks, and cash flow instantly. These tools connect directly with SAP ERP systems like S/4HANA, giving CFOs live insights in one place. Companies report 60 to 70 percent faster close cycles per SAP partner data.
SAP Analytics Cloud Dashboards UAE CFOs Use Daily
The 9 dashboards are financial performance, cash flow, profitability analysis, budget vs actual, working capital, revenue forecasting, cost analysis, workforce analytics, and risk monitoring. Each connects to live data from S/4HANA.
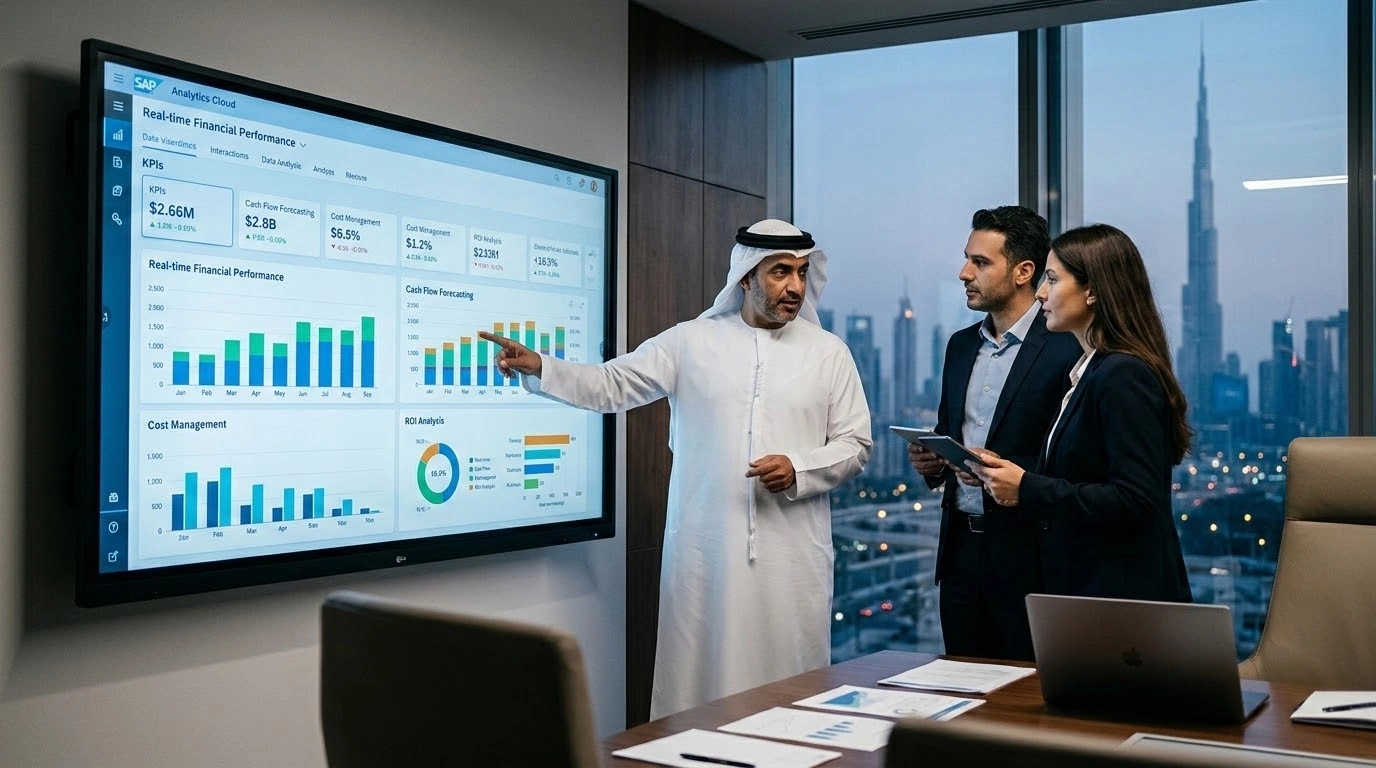
- Financial Performance Dashboard
This is the most used dashboard for any CFO. It provides a complete snapshot of company performance in a single view.
- Profit and loss overview with real time revenue and expense tracking
- Balance sheet insights showing assets, liabilities, and equity
- Operating margin tracking to measure core business profitability
SAP dashboards allow real time tracking of key metrics with drill down analysis. A 2024 Gartner survey of 251 CFOs confirmed metrics remain top priorities.
- Cash Flow Dashboard
Cash flow is critical for business survival. This dashboard tracks liquidity across operations and helps prevent shortfalls before they happen.
- Incoming and outgoing cash tracked in real time
- Payment cycle analysis showing days to collect and to pay
- Liquidity position overview with short term forecasts
SAC connects directly to treasury data and bank feeds. Cash managers can create a liquidity plan based on actual and forecast data.
- Profitability Analysis Dashboard
CFOs need to know what drives profit. This dashboard breaks down margins across segments so leaders can focus on the most profitable areas.
- Product level profitability showing margin per item or service
- Customer level margins revealing which clients generate the most value
- Regional performance comparing profitability across markets
Interactive dashboards display profit margins per project and per business line. Predictive features also support margin forecasting.
- Budget vs Actual Dashboard
Planning accuracy is key for financial control. This dashboard compares planned versus real performance so CFOs can close the gap between expectations and results.
- Variance analysis showing over and under performance by category
- Forecast adjustments based on current trends
- Department level insights so business unit leaders own their numbers
SAC allows users to compare budgets, actuals, and forecasts as a standard feature. Teams implementing it report 60 to 70 percent reduction in close reporting time.
- Working Capital Dashboard
Efficient capital management improves cash flow. This dashboard tracks key components of working capital that keep a business running smoothly.
- Accounts receivable aging to identify overdue payments
- Accounts payable tracking to optimize payment timing
- Inventory levels monitored to prevent overstocking or shortages
SAP provides an integrated working capital dashboard built on SAP Datasphere models. It visualizes KPIs based on live data from sap erp systems including S/4HANA.
- Revenue Forecasting Dashboard
Future visibility helps strategic decisions. This dashboard uses historical and predictive data to project where revenue is heading.
- Revenue trends visualized across time periods and business units
- Forecast scenarios showing best case, worst case, and likely outcomes
- Demand signals connecting pipeline data to revenue projections
Among SAP Products, Analytics Cloud includes predictive planning that uses automated machine learning to turn historical data into accurate forecasts without needing data science skills.
- Cost Analysis Dashboard
Cost control directly impacts margins. This dashboard tracks operational and project costs so CFOs can find savings and stop waste. Nearly half of CFOs are focusing on cost management in 2025 per Gartner research.
- Cost center performance comparing actual spend against budgets
- Expense trends showing where costs increase over time
- Cost reduction opportunities flagged by anomaly detection
Dynamic dashboards in SAC offer real time insights into production costs and expense performance with drill down analysis.
- Workforce Analytics Dashboard
People’s costs are a major expense category. This dashboard connects HR and finance data so CFOs can see the full picture of workforce spending.
- Headcount trends showing hiring velocity and attrition rates
- Cost per employee broken down by department and role
- Productivity metrics connecting output to labor spend
Cross functional dashboards combine financial and HR data for deeper insights. SAC integrates with workforce planning tools to measure the impact of investments.
- Risk and Compliance Dashboard
Risk visibility protects financial stability. This dashboard highlights potential issues early so CFOs can act before problems grow.
- Financial risks tracked with probability levels and impact estimates
- Compliance tracking against regulatory requirements and policies
- Audit indicators showing control effectiveness and exceptions
SAP Risk Management integrates with SAC to deliver six prebuilt risk dashboards including a risk count heatmap. Only 37 percent of UAE finance leaders report positive ROI from AI.
Key Takeaways
- SAP Analytics Cloud dashboards UAE CFOs use daily cover nine core areas from financial performance to risk monitoring
- Real time data connections to sap erp systems eliminate manual reporting delays
- Predictive analytics in SAP Products support revenue forecasting and margin projections
- Cross functional dashboards combine finance and HR data for cost visibility
- Companies implementing SAC report 60 to 70 percent reduction in close reporting time